Appearance
Charging Sessions
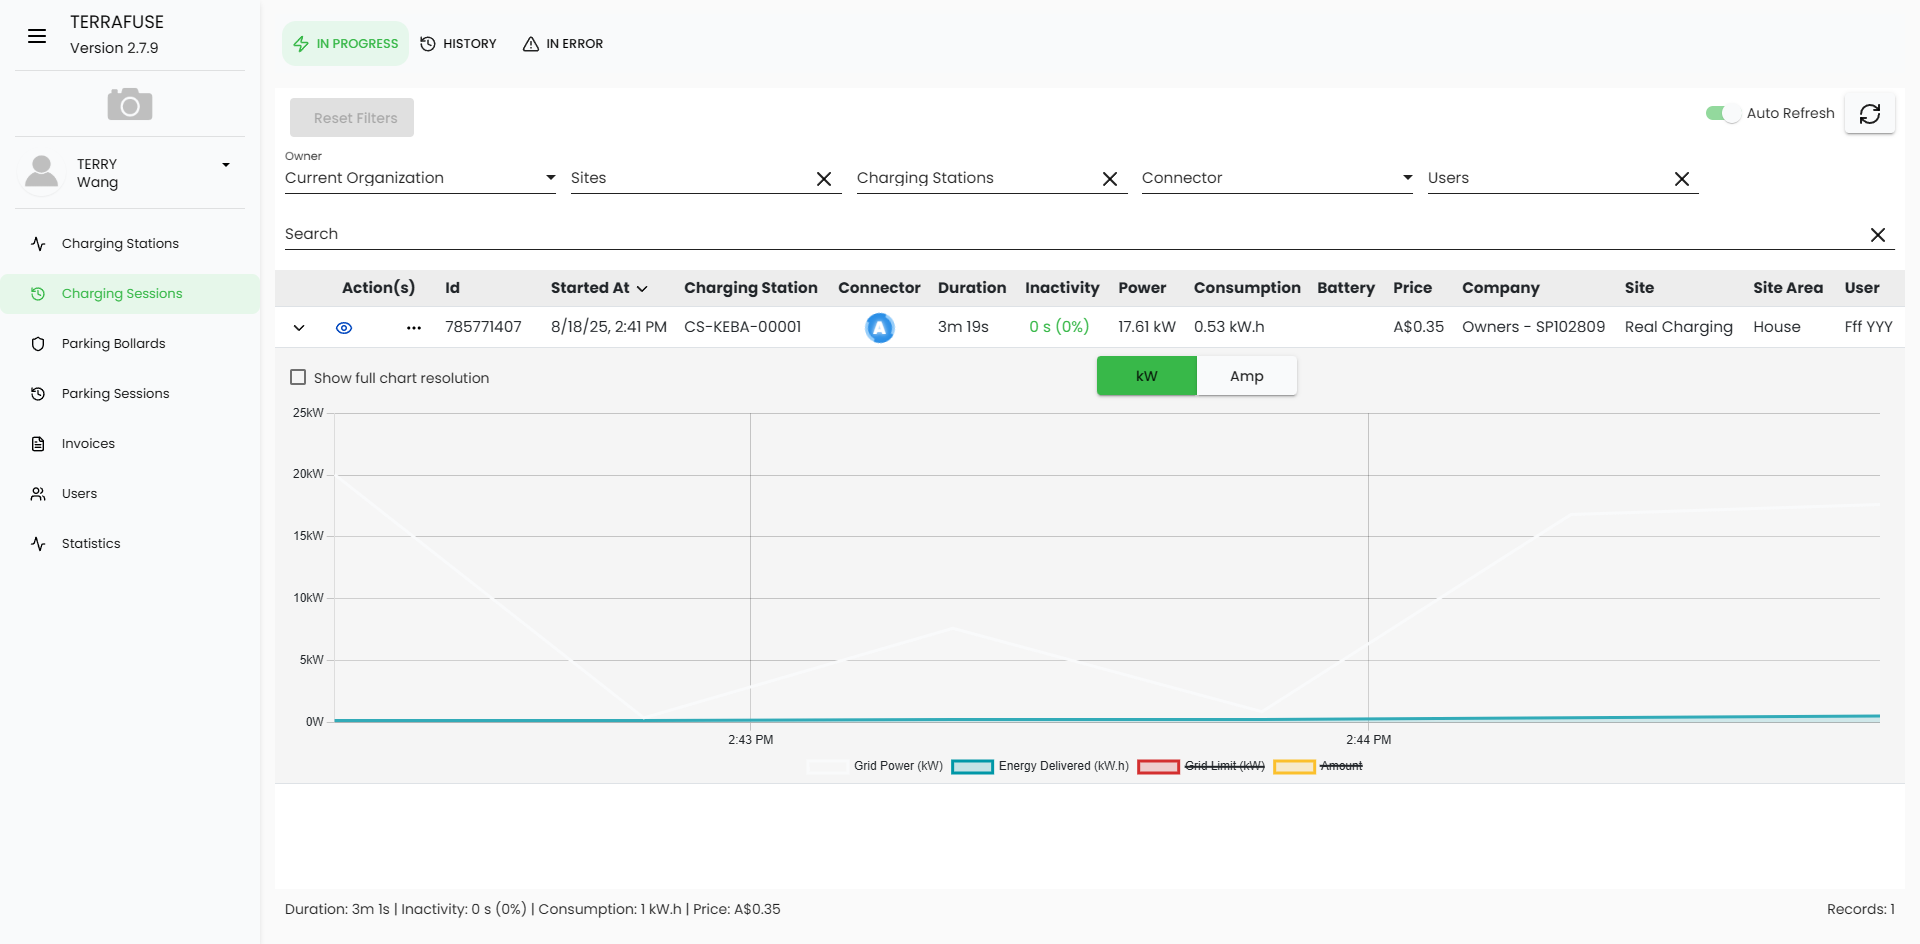
The Charging Sessions page allows managers to view and monitor all charging activity, as shown in Figure 4.3.1.
From the menu, managers can access two tabs: In Progress and History.
In Progress Charging Sessions
The In Progress tab shows all charging sessions that are currently active.
Each session is displayed in a table, with the following details, as shown in Figure 4.3.2:
Session Details Table
| Field | Description |
|---|---|
| Actions | Options to view more details about the session. |
| ID | Unique identifier of the charging session. |
| Started At | Date and time when the charging session started. |
| Charging Station | The station being used for charging. |
| Connector | The connector being used at the station. |
| Duration | Total elapsed time since the charging began. |
| Inactivity | Time spent idle during the session (e.g., vehicle plugged but not charging). |
| Power | Current power being delivered (kW). |
| Consumption | Total energy consumed during the session (kWh). |
| Battery | Battery percentage of the vehicle (if available). |
| Price | Cost of the current session, based on rates set by building management. |
| Company | The organization that owns or manages the charging station. |
| Site | The specific site where the charging station is located. |
| Site Area | Sub-area or zone within the site. |
| User | The resident or person using the charging station. |
Actions
Each row in the In Progress and History table has an Actions column with two buttons:
- View (👁️) – Opens the live session details.
- More (⋮) – Shows additional management actions.
View Session (Eye Button)
Clicking on the eye button (View) opens a session detail modal with two main interfaces:
1. Power & Energy Graph View
This view provides a graphical representation of the session’s charging performance, as shown in Figure 4.3.3.
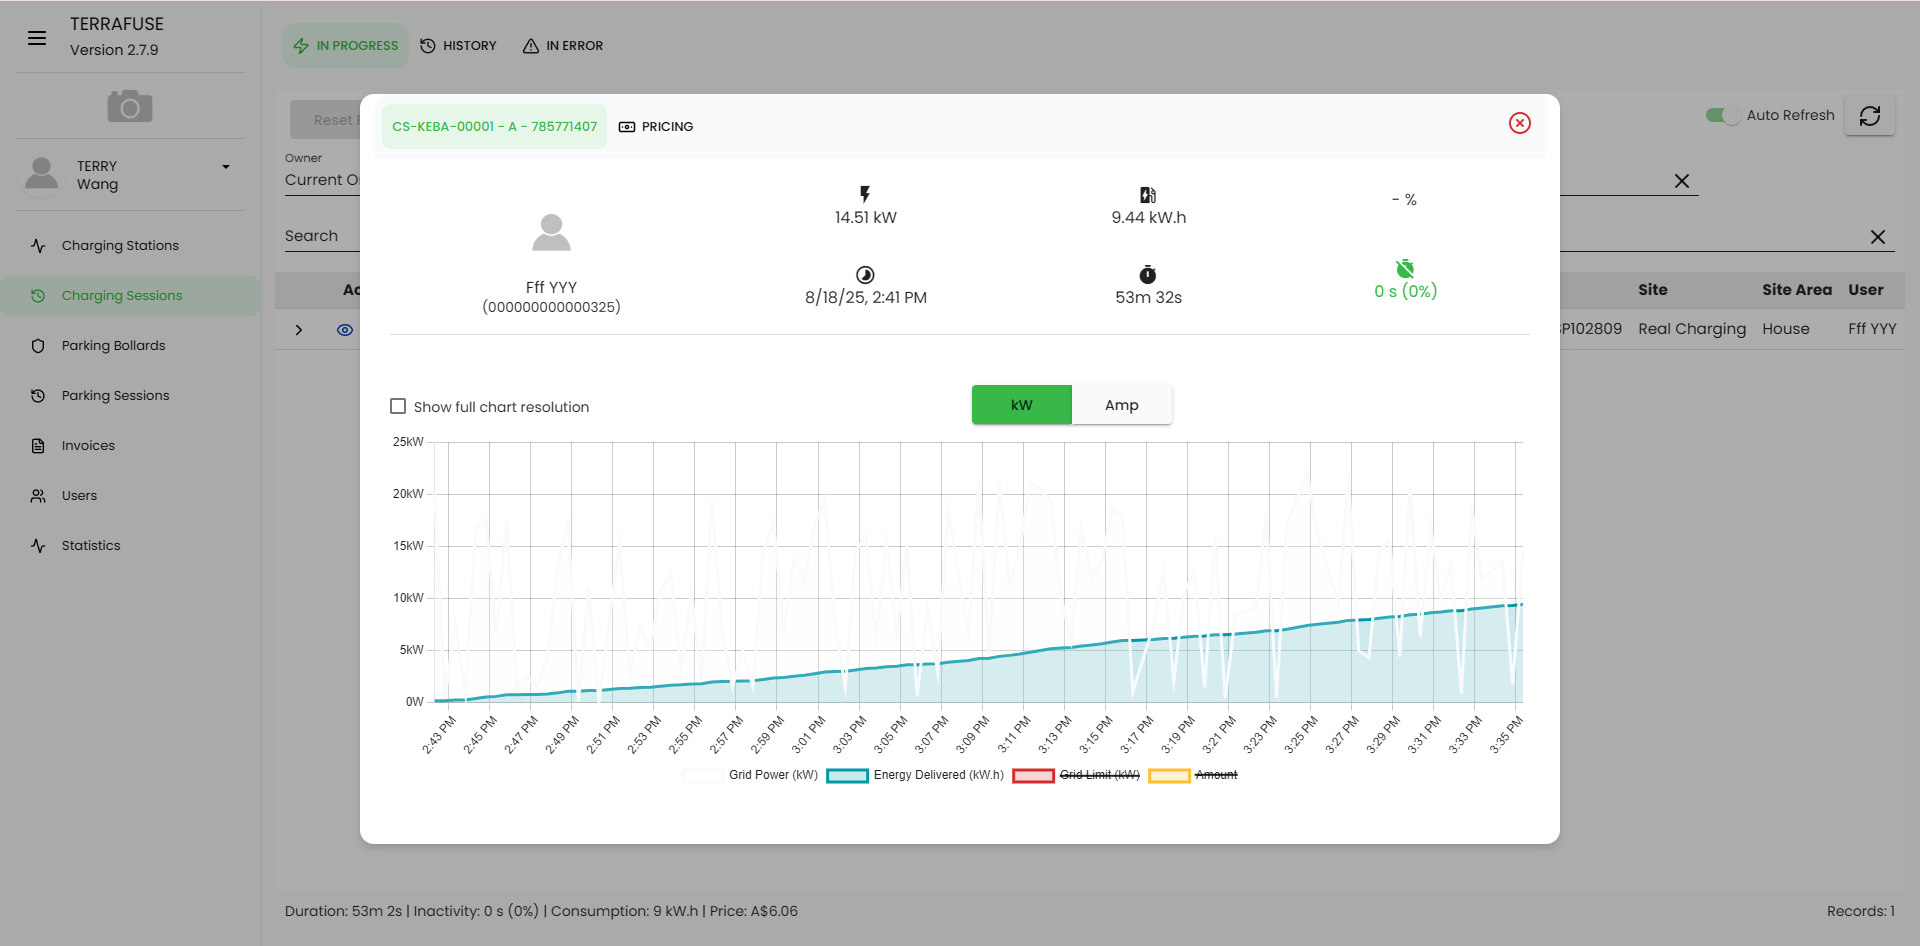
- User Information – Same as above.
- Session Stats – Current power, energy delivered, duration, inactivity.
- Graph –
- Grid Power (kW) – The live power being drawn.
- Energy Delivered (kWh) – Cumulative energy charged.
- Grid Limit (A) – Maximum allowed current (if applicable).
- Amount – Charging cost trend (if enabled).
The chart updates live and allows managers to track charging patterns, spikes, and efficiency.
2. Pricing & Consumption View
This view shows pricing details and the breakdown of energy consumption (Figure 4.3.4).
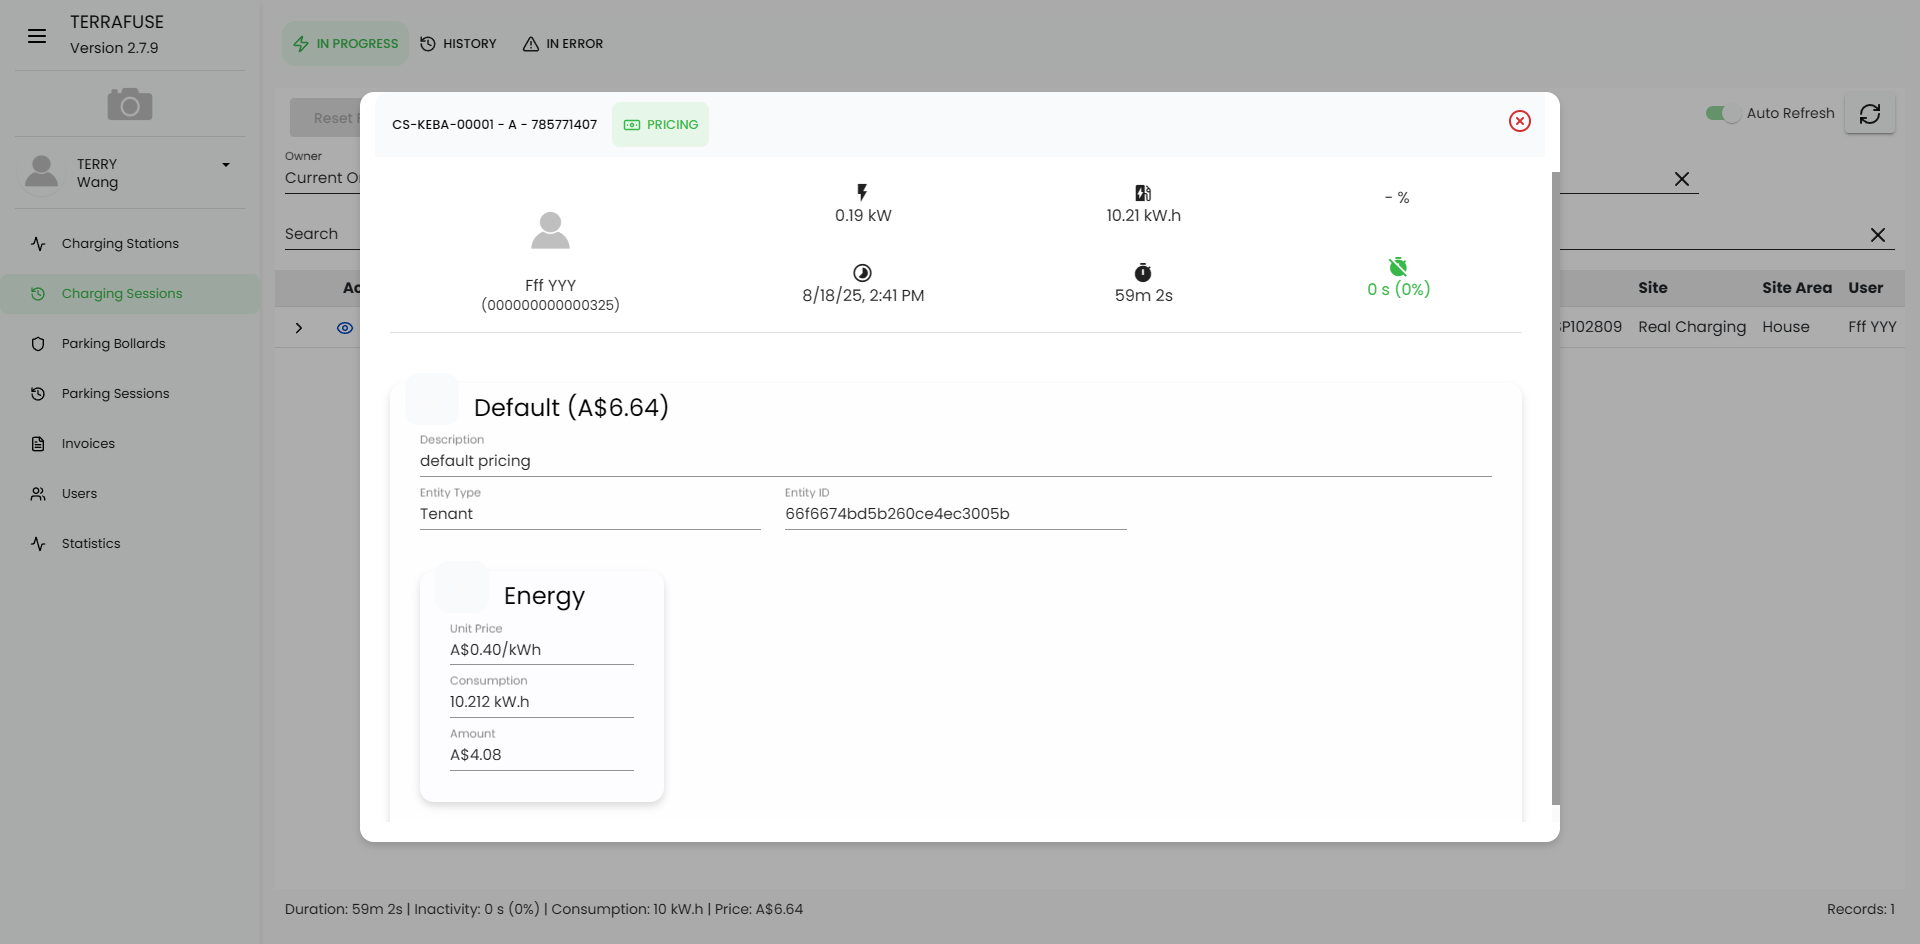
- User Information – Who is charging, with their unique identifier.
- Session Stats – Current power, total energy delivered, start time, duration, and inactivity.
- Pricing Breakdown –
- Description of the applied pricing policy (e.g., Default Pricing).
- Entity Type (Tenant, Visitor, etc.).
- Entity ID (internal reference).
- Energy Section –
- Unit Price (cost per kWh).
- Consumption (energy used so far in kWh).
- Amount (total price calculated from consumption).
This helps managers verify costs in real time.
TIP
For In Progress sessions, the graph updates live.
For History sessions, the graph shows a full playback of how the charging evolved over time.
History (Past Sessions)
The History tab shows all past (completed) charging sessions, shown in Figure 4.3.5.
Managers can filter sessions by date range, site, connector, or user.
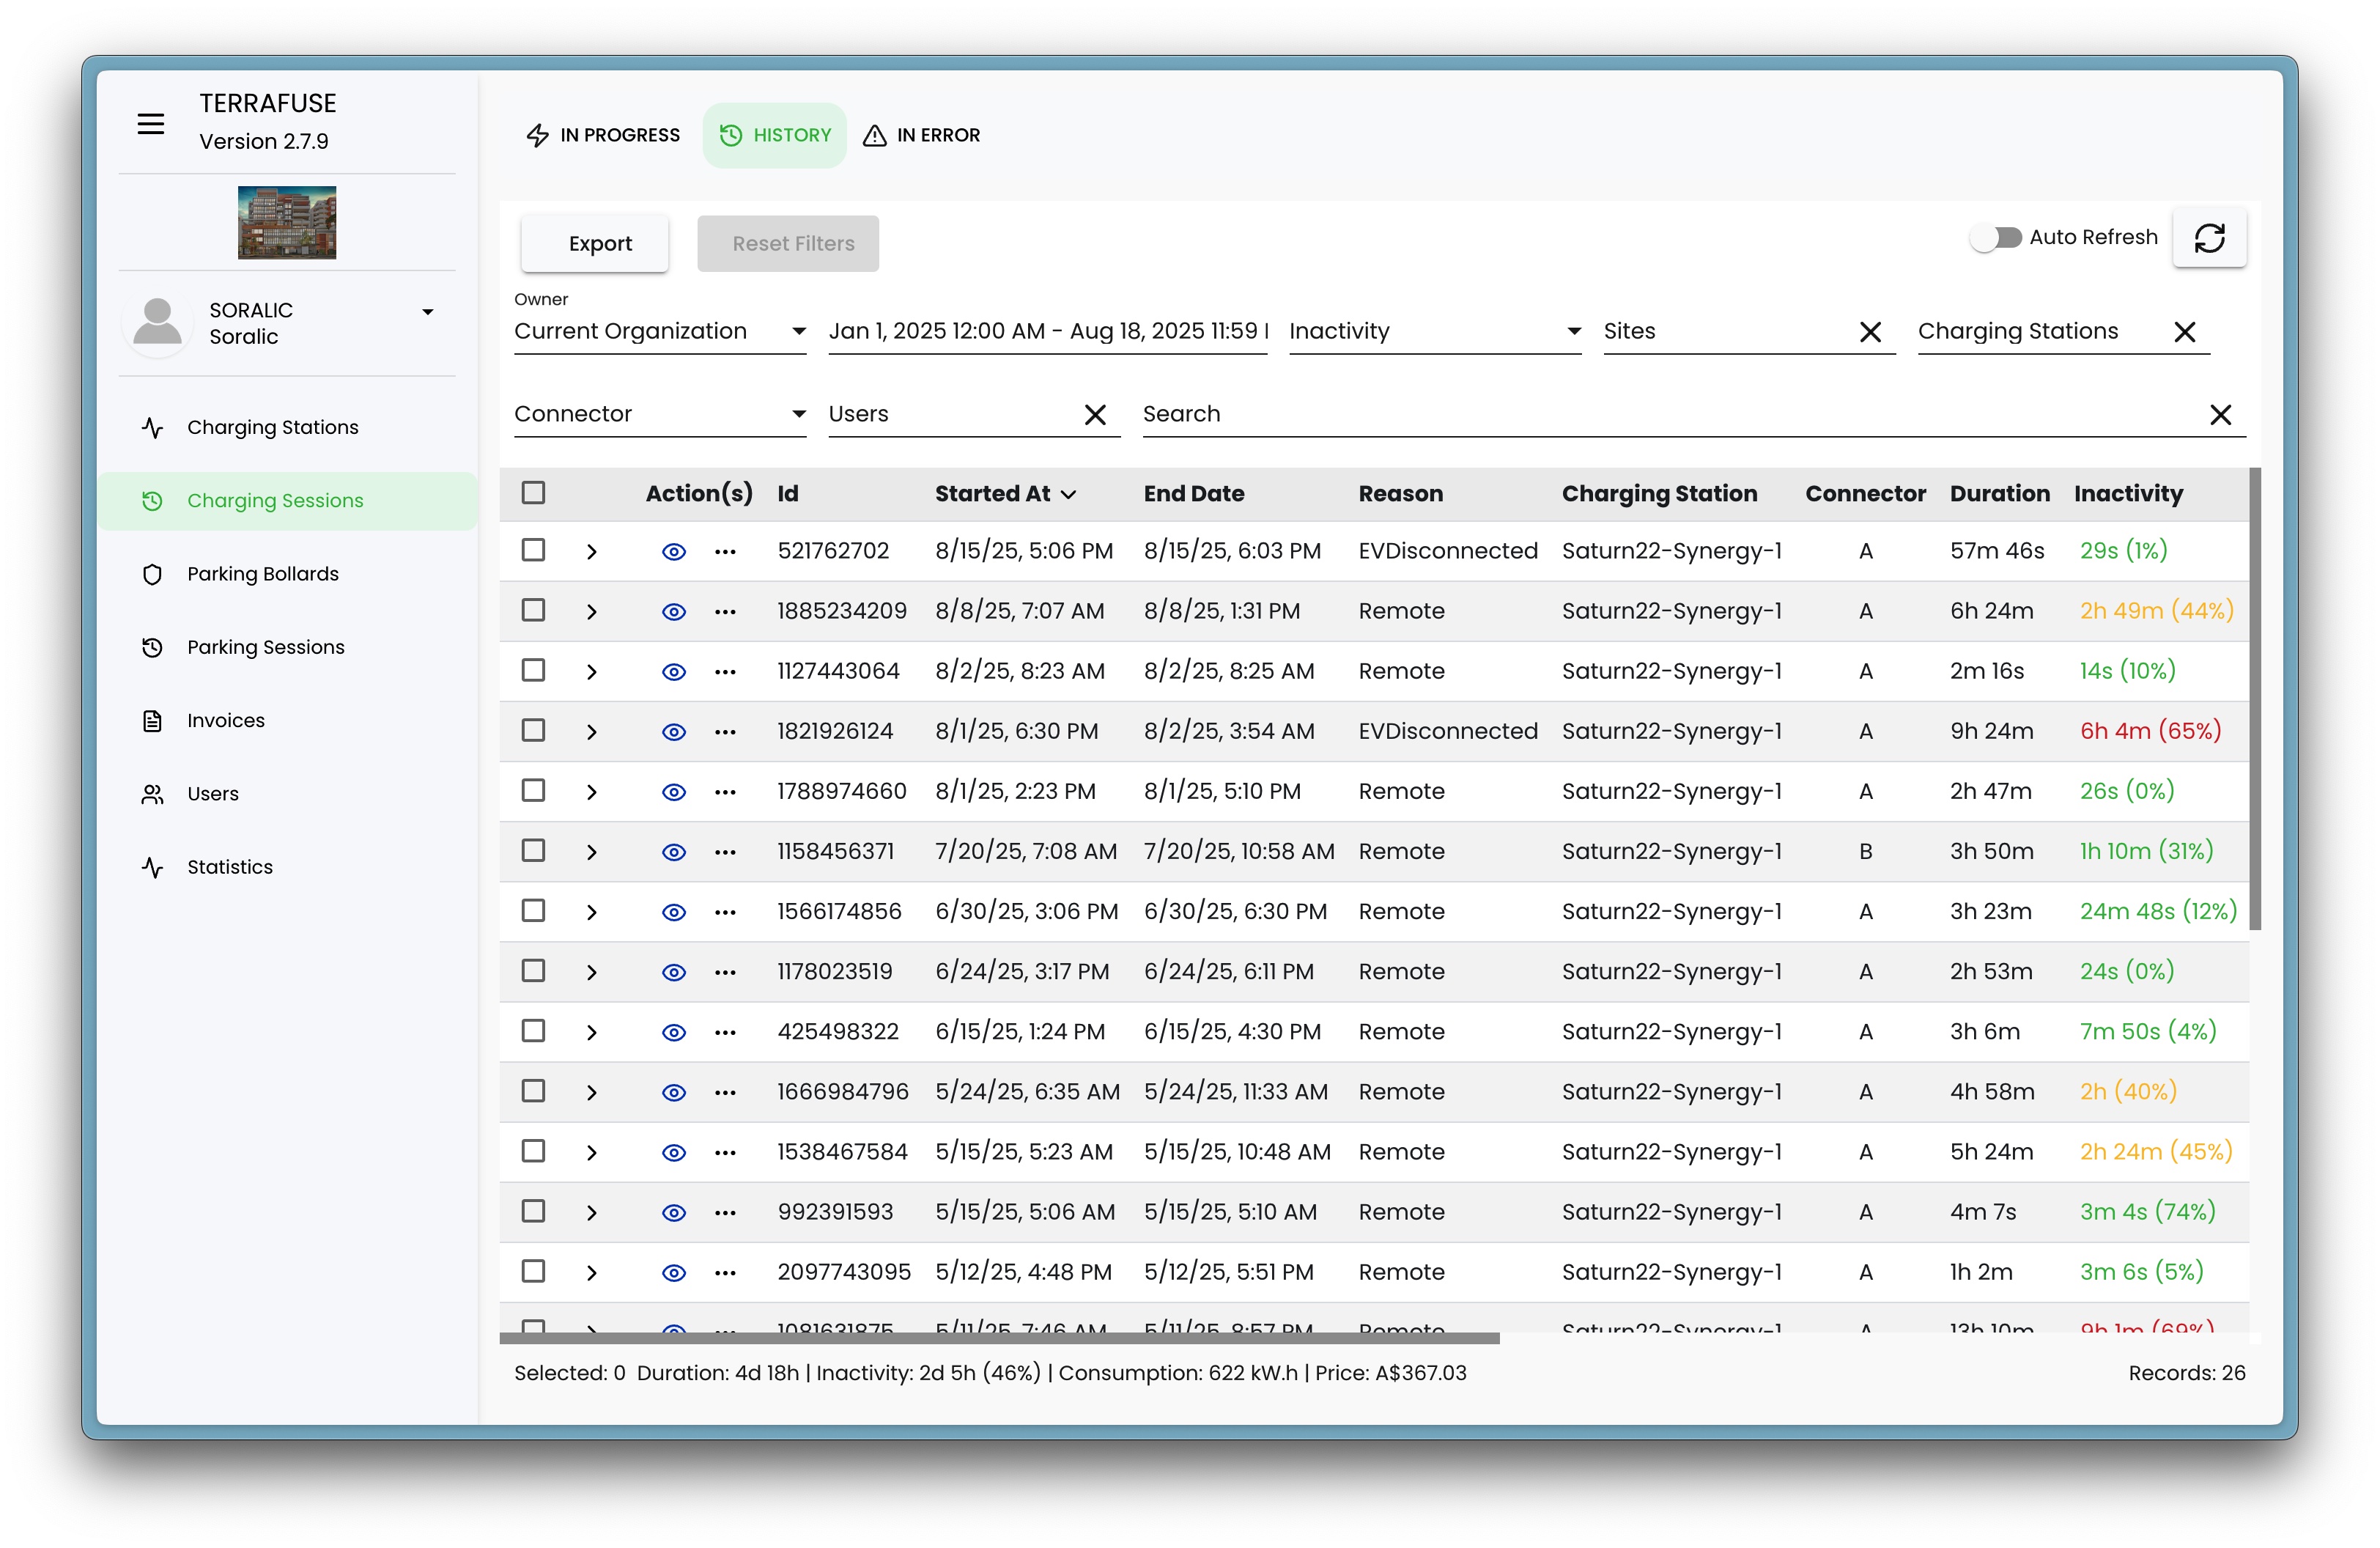
History Details Table
| Field | Description |
|---|---|
| Actions | Options to view more details about the past session. |
| ID | Unique identifier of the charging session. |
| Started At | Date and time when the charging session began. |
| End Date | Date and time when the charging session ended. |
| Reason | The reason the session ended (e.g., EV disconnected, stopped by user). |
| Charging Station | The station that was used. |
| Connector | The connector that was used. |
| Duration | Total length of the session. |
| Inactivity | Time the vehicle was connected but not actively charging. |
| Consumption | Total energy consumed during the session (kWh). |
| Price | Cost of the session. |
Graph View
- Like in-progress sessions, clicking a row expands a graph of the session (Figure 4.3.6).
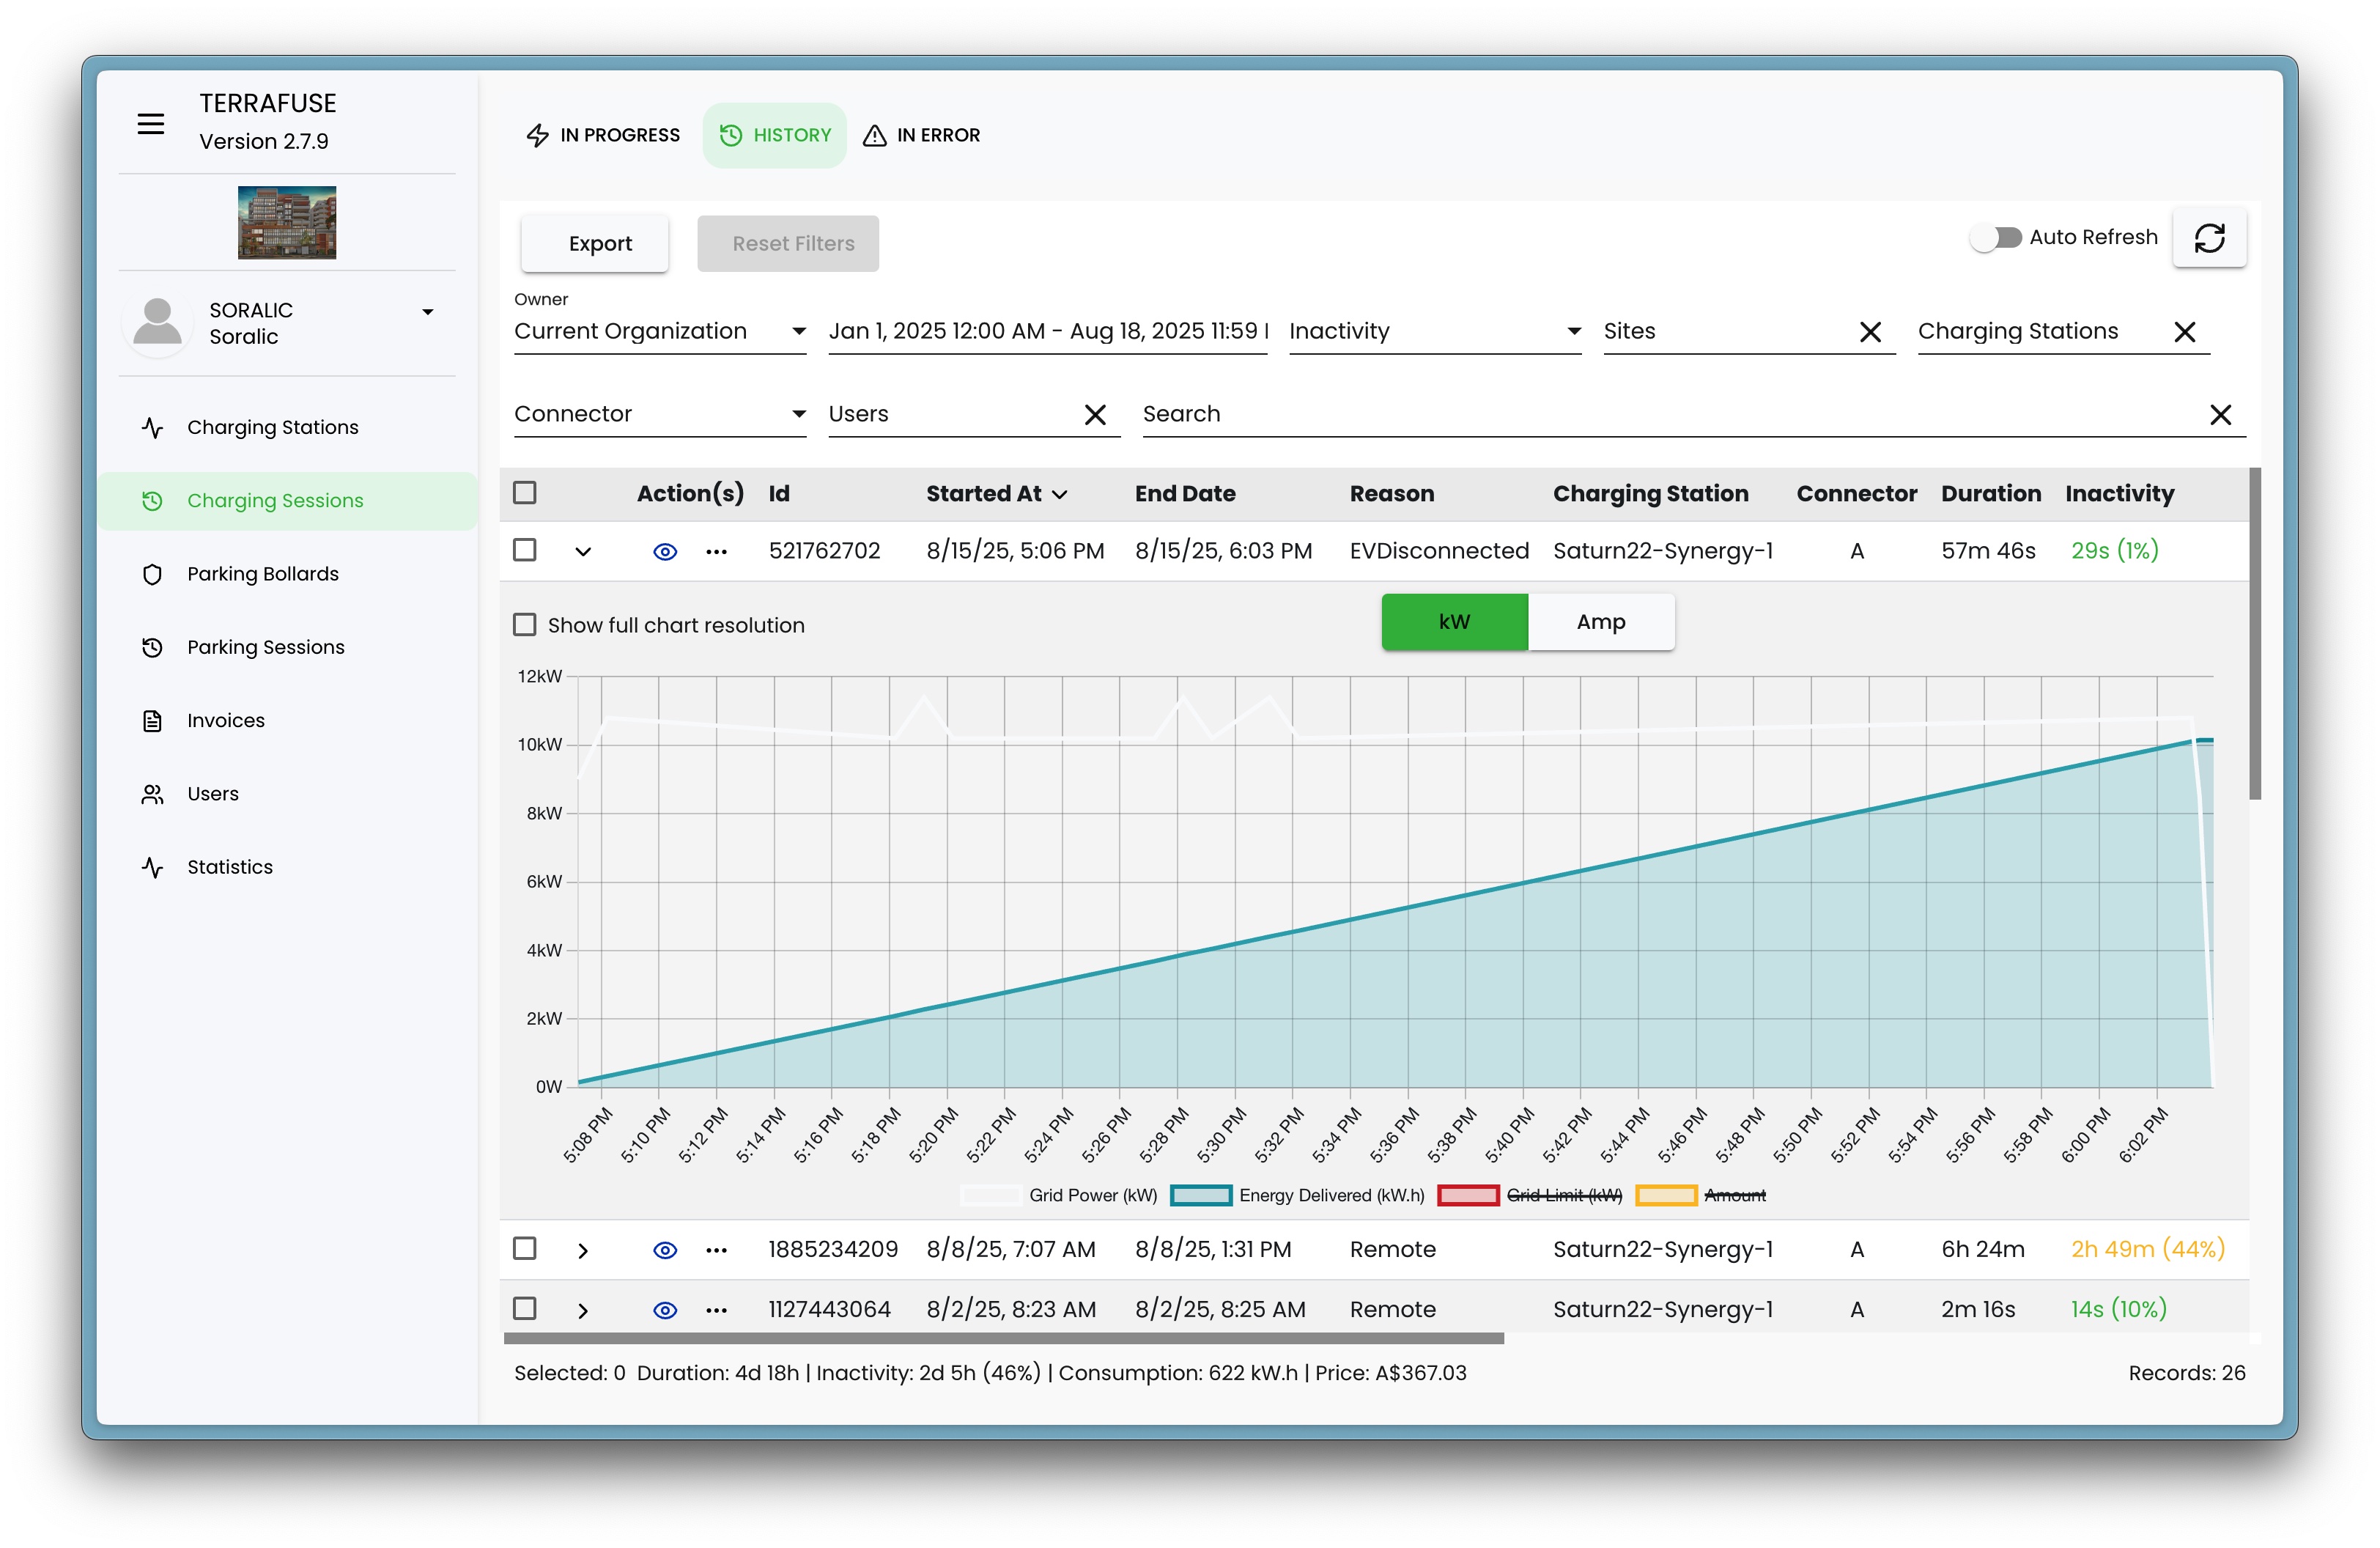
- The graph shows energy delivered over time, giving managers insights into charging behavior and efficiency.
Filtering & Search
Both In Progress and History tabs allow managers to do the following (Figure 4.3.7):
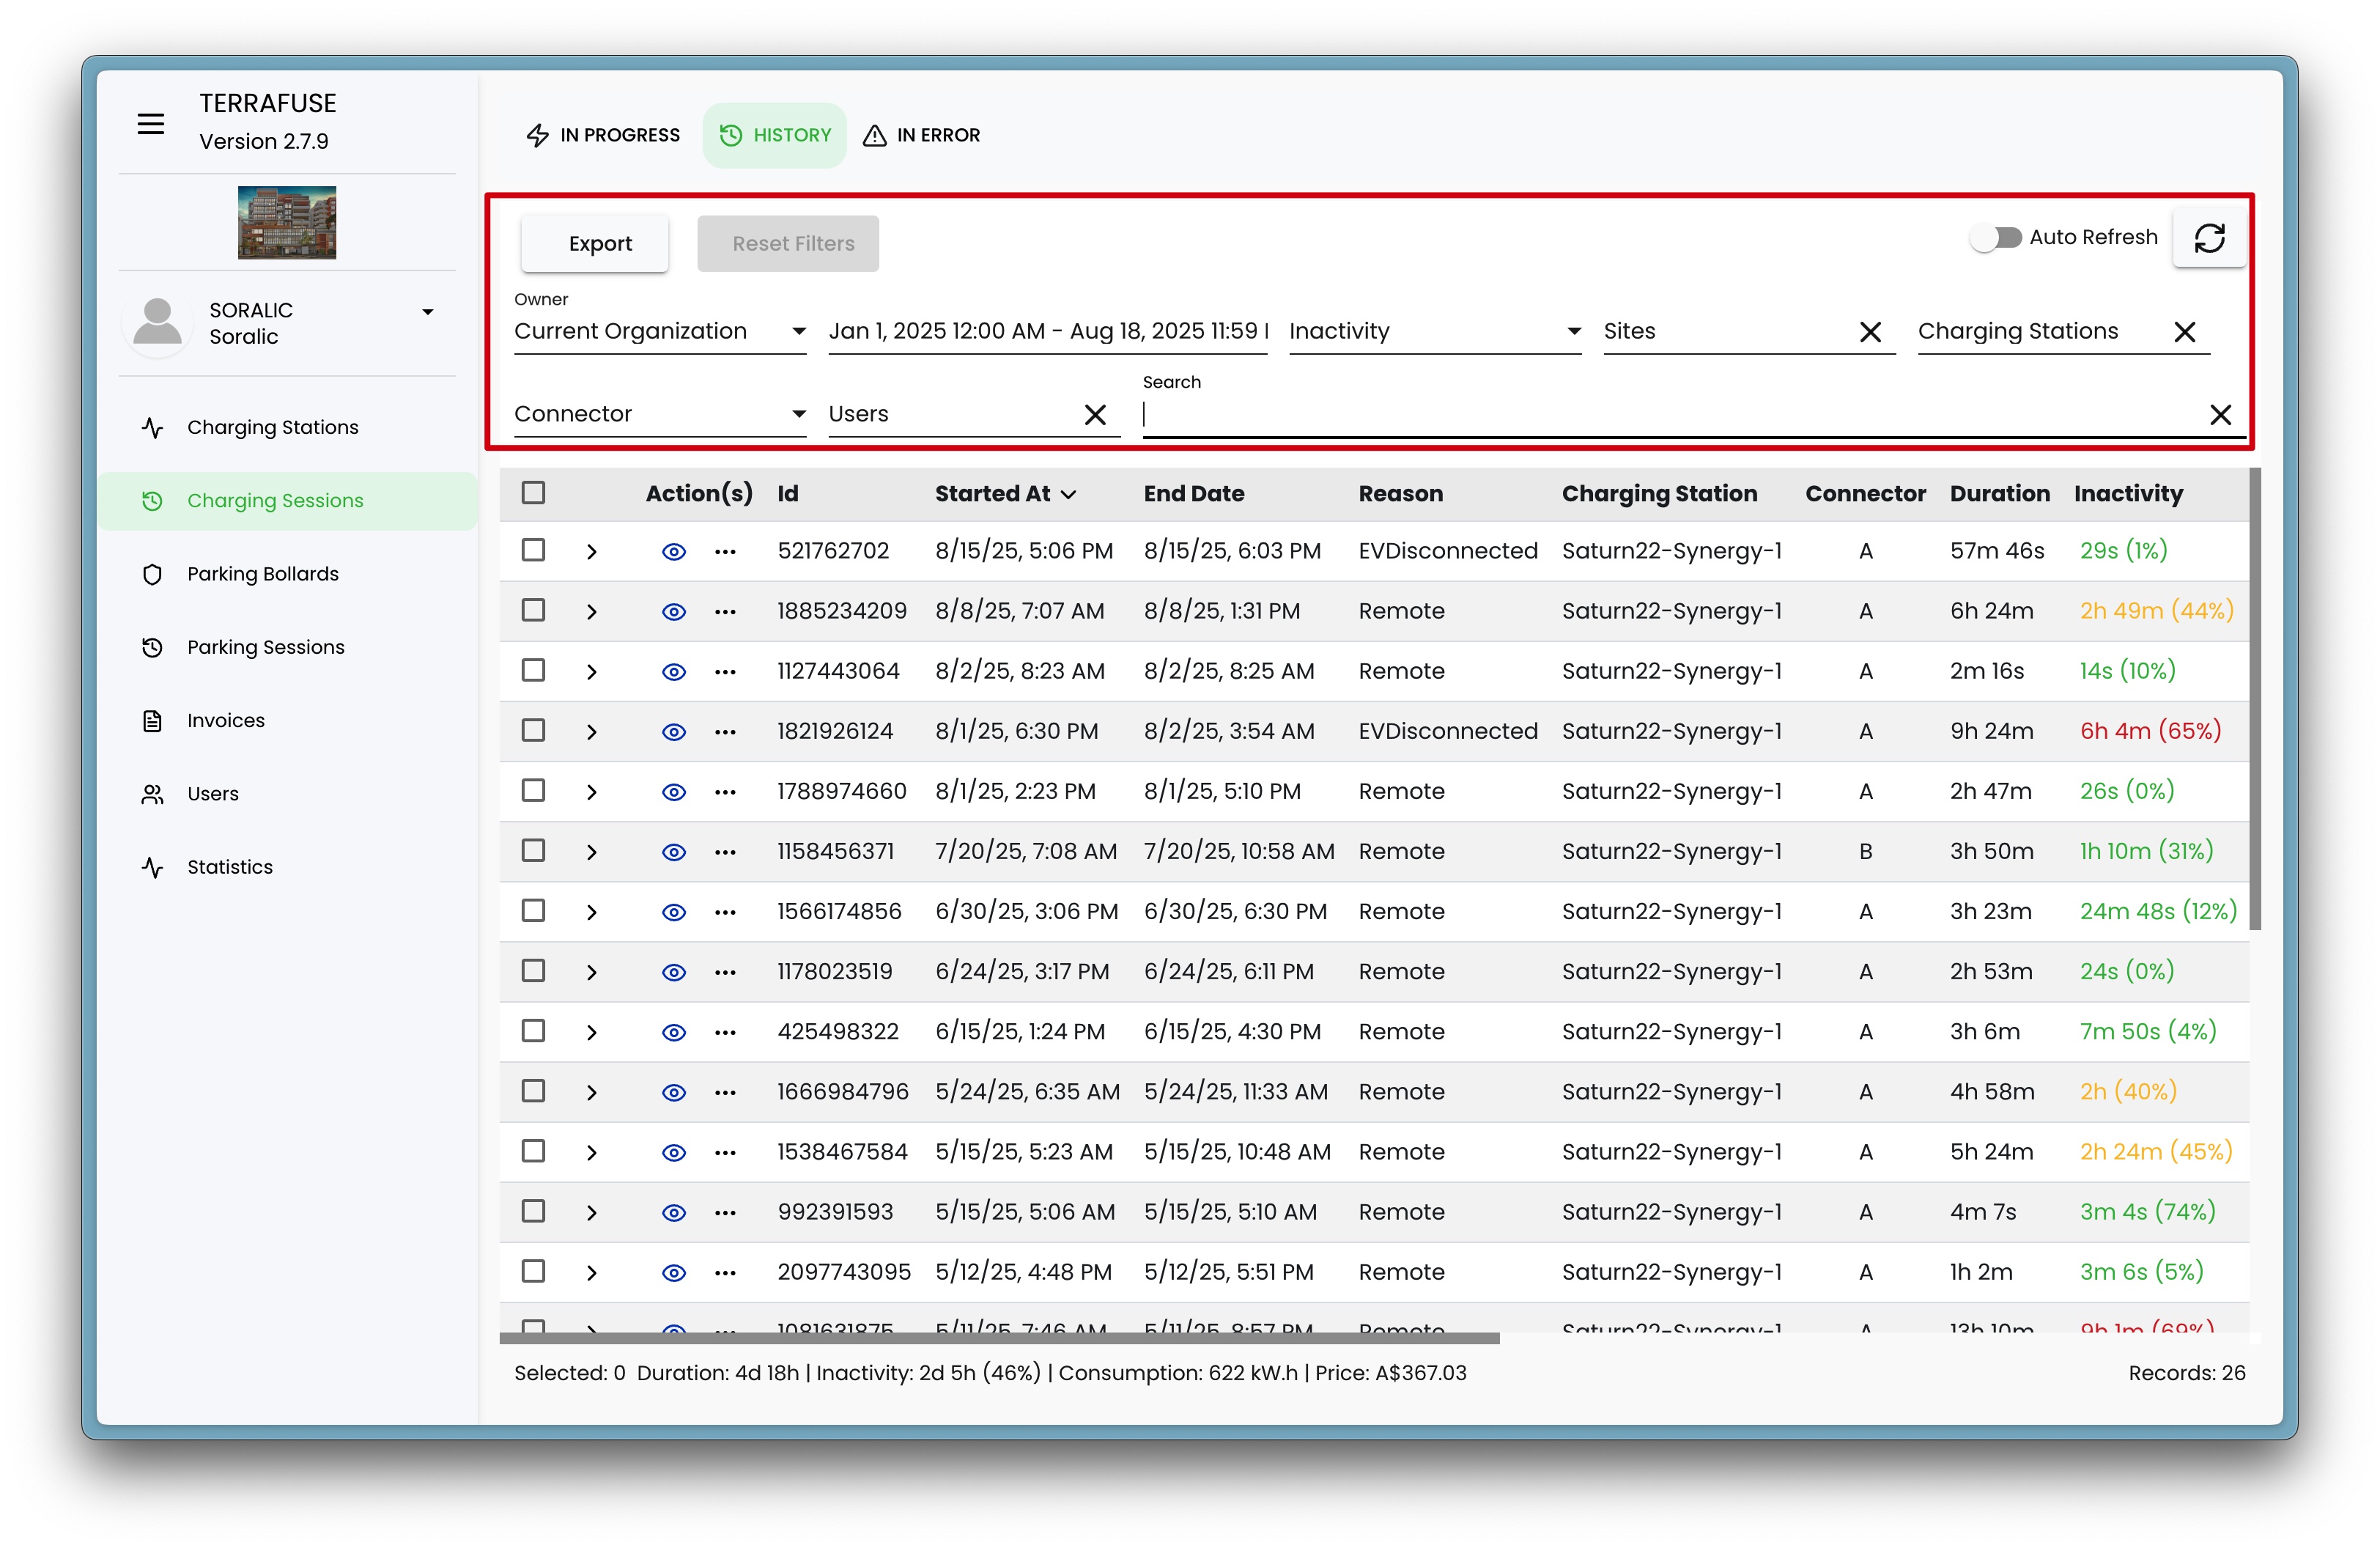
- Search by user, connector, or station.
- Filter by date range, site, or inactivity.
- Export data for reporting and analysis.
With this setup, managers can easily monitor live charging activity, review past usage, and identify patterns that help optimize station management.